Alzheimer’s disease (AD) is a neurodegenerative disorder that affects millions worldwide, primarily causing memory loss and cognitive decline [Scheltens et al., 2021]. While much of this research looks at AD through genetics, molecular biology, and neuroimaging [Geerts et al., 2016], this study takes an innovative approach: applying computational models rooted in statistical physics to better understand how brain connectivity changes in AD. Specifically, this work leverages a technique known as spin-glass modeling to explore the differences between the brains of AD patients and healthy individuals, providing a new lens through which to view brain dynamics.
In an earlier study [Ruffini et al., 2023], we applied similar techniques based on the Ising model to explore how brain states differ when individuals are under the influence of psychedelics versus a placebo.
The Brain as a Complex System
The brain is a complex network made up of interconnected regions that communicate to process information, form memories, and control behavior. Like many complex systems, it operates near a critical point, a state that allows it to shift between ordered and disordered states. This balance provides the brain with the flexibility it needs to respond effectively to both internal and external stimuli. Similar to how physical materials transition between solid, liquid, and gas phases, the brain’s neural networks can switch between synchronized and unsynchronized states. This idea, known as the critical brain hypothesis, suggests that the brain operates near a critical point, allowing it to process information efficiently [Chialvo, 2004; Chialvo et al., 2010; Cocchi et al., 2017].
In this study, we explored whether AD pushes the brain closer to a disordered state. Using functional MRI (fMRI) data, we applied spin-glass models to map the functional connectivity of brain regions and compared these maps between AD patients and healthy controls. The goal was to see if AD causes brain regions to become less connected and how this might relate to the disease’s progression.
Spin-Glass Modeling and the Coupling Matrix (J)
The spin-glass model is a powerful tool from statistical physics, initially designed to study disordered materials. In this context, we used it to model the brain’s regions as individual “spins,” which can be either active or inactive. The interactions between these regions are captured in the coupling matrix (J), which represents how strongly different areas of the brain are connected. By comparing the J matrices of AD patients to those of healthy individuals, we aimed to identify changes in brain connectivity caused by the disease.
The Sherrington-Kirkpatrick (SK) spin-glass model [Sherrington et al., 1975], which allows for disordered interactions between spins, was used to extract the coupling matrix from the fMRI data. This was done by maximizing the likelihood that the model’s spin configurations would match the observed data [Ezaki et al., 2017].
Main Findings: Reduced Homotopic Connectivity in Alzheimer’s
One of the key results from this thesis was a noticeable decrease in homotopic connectivity—the connections between matching regions in the left and right hemispheres of the brain—in AD patients. This decrease was statistically weak but consistent with other studies showing that Alzheimer’s disrupts communication between the two sides of the brain [Qiu et al., 2016]. The reduced connectivity in these regions could be linked to the cognitive decline seen in AD, where coordination between brain hemispheres becomes less efficient [Wang et al., 2015, Chen et al., 2023].

Simulating Brain Dynamics: Critical Temperature and Disorder
Beyond examining static brain connectivity, we ran simulations using the Metropolis algorithm, a method that allowed us to study how the brain’s network behaves at different levels of “thermal agitation” (a concept analogous to noise or disorder in the system) [Metropolis et al., 1953]. These simulations revealed that the brain networks in AD patients transitioned to a disordered state at a lower critical temperature than in healthy individuals. In simple terms, the brains of AD patients are closer to a state of disorder, which may explain the cognitive symptoms of the disease.

Comparing the Coupling Matrix (J) and dMRI Connectome
In addition to examining the functional connectivity captured by the J matrix, we compared it to the diffusion MRI (dMRI) connectome, which maps the brain’s physical connections—particularly the white matter tracts that link different brain regions [Le Bihan, 2003]. While dMRI provides valuable insights into the brain’s structural “hardware,” it cannot capture the dynamic, functional interactions between regions. Interestingly, we found that the J matrix not only mirrored some of the structural patterns seen in dMRI but also went beyond capturing functional interactions, such as homotopic and inhibitory connections, which dMRI alone cannot detect.
This comparison highlights the potential of the coupling matrix (J) as a useful proxy for structural data when dMRI is unavailable. The J matrix provides a more holistic view of brain connectivity by incorporating both structural and functional data, which is particularly useful in understanding how Alzheimer’s disrupts brain activity.

Conclusion and Future Directions
Our study sheds new light on how Alzheimer’s disease affects brain connectivity. By applying a spin-glass model, we were able to demonstrate reduced homotopic connectivity, a lower critical temperature, and important insights from comparing functional and structural brain connectivity. These findings could have implications for future research, particularly in the development of targeted treatments for Alzheimer’s that aim to restore brain connectivity.
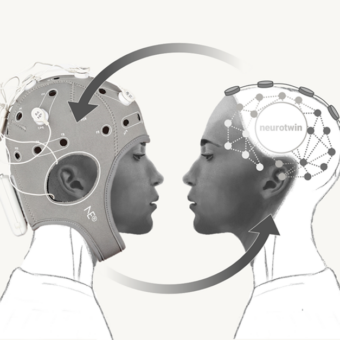
This work is part of the broader Neurotwin project [neurotwin.eu], which aims to create personalized digital models of the brain to optimize brain stimulation treatments. In future research, we plan to explore whether brain stimulation therapies can alter the coupling matrix and bring the AD brain closer to a healthy state. By continuing to investigate these complex dynamics, we hope to open new avenues for early diagnosis and more effective treatments for Alzheimer’s disease.
References:
- Scheltens, P., De Strooper, B., Kivipelto, M., Holstege, H., Chételat, G., Teunissen, C.E., Cummings, J., & van der Flier, W.M. (2021). Alzheimer’s disease. Lancet, 397, 1577.
- Geerts, H., Dacks, P.A., Devanarayan, V., Haas, M., Khachaturian, Z.S., Gordon, M.F., Maudsley, S., Romero, K., & Stephenson, D. (2016). Big data to smart data in Alzheimer’s disease: The brain health modeling initiative to foster actionable knowledge. Alzheimer’s & Dementia, 12(9), 1014-1021.
- Ruffini, G., Damiani, G., Lozano-Soldevilla, D., Deco, N., Rosas, F. E., Kiani, N. A., Ponce-Alvarez, A., Kringelbach, M. L., Carhart-Harris, R., & Deco, G. (2023). LSD-induced increase of Ising temperature and algorithmic complexity of brain dynamics. PLoS computational biology, 19(2), e1010811.
- Chialvo, D. R. (2004). Critical brain networks. Physica A, 340(4), 756-765. Elsevier BV.
- Chialvo, D.R. (2010). Emergent complex neural dynamics. Nature Physics.
- Cocchi, L., et al. (2017). Criticality in the brain. Neuroscience Review.
- Sherrington, D., & Kirkpatrick, S. (1975). Solvable model of a spin-glass. Physical Review Letters, 35(26), 1792-1796.
- Ezaki, T., Watanabe, T., Ohzeki, M., & Masuda, N. (2017). Energy landscape analysis of neuroimaging data. Philosophical Transactions of the Royal Society A: Mathematical, Physical and Engineering Sciences, 375, 20160287.
- Qiu, Y., Liu, S., Hilal, S., Loke, Y.M., Ikram, M.K., Xu, X., Tan, B.Y., Venketasubramanian, N., Chen, C., & Zhou, J. (2016). Inter-hemispheric functional dysconnectivity mediates the association of corpus callosum degeneration with memory impairment in AD and amnestic MCI. Scientific Reports, 6, 32573.
- Wang, Z., Wang, J., Zhang, H., McHugh, R., Sun, X., Li, K., & Yang, Q.X. (2015). Interhemispheric functional and structural disconnection in Alzheimer’s disease: A combined resting-state fMRI and DTI study. PLOS ONE, 10(5), 1-16.
- Chen, S., Wu, H., Song, Y., Ge, H., Yan, Z., Xue, C., Qi, W., Yuan, Q., Lin, X., & Chen, J. (2023). Altered structural and functional homotopic connectivity associated with the progression from mild cognitive impairment to Alzheimer’s disease. Psychiatry Research, 319, 115000.
- Metropolis, N., et al. (1953). Equation of state calculations by fast computing machines. Journal of Chemical Physics, 21(6), 1087-1092.
- Le Bihan, D. (2003). Looking into the functional architecture of the brain with diffusion MRI. Nature Reviews Neuroscience, 4(6), 469–480.
- Neurotwin Project. (2023). Neurotwin. https://neurotwin.eu.


